This past week the stock market continued to advance while bond prices fell with rising yields as investors anticipate a Trump presidency will result in faster economic growth, stronger corporate earnings growth, and higher inflation.
 This outlook to a certain extent was validated on Thursday when Federal Reserve Chair Janet Yellen testified before the Joint Economic Committee of Congress appearing to confirm recent economic data have been strong enough to persuade the Fed to raise interest rates during its December 13–14 FOMC meeting. Yellen said the Fed could raise interest rates “relatively soon if economic data keeps pointing to an improving labor market and rising inflation.” Yellen said the case for a rate hike had strengthened with the economy appearing on track to grow moderately, which would help bring about full employment and push inflation higher toward the Fed’s 2% target. The Fed Funds futures market is currently pricing in a 95.6% probability for a rate hike of 25 basis points.
The week’s economic news was mostly positive. October Retail Sales highlighted continuing strength in the U.S. economy with a reading of 0.8% versus a consensus estimate of 0.6%. When excluding automobiles, Retail Sales still climbed 0.8% compared to a forecast of 0.5%. In the area of manufacturing, the Federal Reserve Bank of New York reported its Empire State Manufacturing Index showed some expansion with a reading of 1.5 for November that was above the consensus forecast of -0.5 and notably higher than October’s -6.8 reading.
Inflation data was mixed. The Department of Labor reported inflation at the producer or wholesale level was non-existent in October as the Producer Price Index (PPI) for final demand was flat at 0.0%. Furthermore, the so called Core PPI, which excludes the volatile categories of food and energy, declined by 0.2% when the forecast had called for a gain of 0.2%. Meanwhile, inflation at the consumer level as measured by the Consumer Price Index (CPI) increased 0.4% in October following a 0.3% rise in September. On a year-over-year basis the CPI has risen 1.6%, the largest such increase since October 2014. However, the Core CPI, which strips out food and energy costs, only advanced 0.1% last month to match September’s gain. As a result, the year-on-year increase in the Core CPI fell to 2.1% from a 2.2% gain in September.
Housing data remains strong. The National Association of Home Builders (NAHB) reported their Housing Market Index was unchanged for November, matching October’s level of 63. This was close to the consensus forecast of 64. The current sales index was unchanged at 69, while the buyer traffic index edged higher to 47 from 46. However, the index for sales expectations in six months slipped slightly to 69 from 71.
Furthermore, the Commerce Department reported Housing Starts surged to a nine year high in October as homebuilders broke ground at a seasonally adjusted annual pace of 1.32 million units, a 25.5% increase, and the highest level since August 2007. October Starts easily beat the consensus forecast of 1.178 million units and were led by a 75% surge in multifamily units. Further, Housing Permits for new construction were reported higher than forecast with a 0.3% gain, an annual rate of 1.23 million. Permits indicate the strength of future demand and are currently running about 5% above year-ago levels.
As for mortgages, the Mortgage Bankers Association (MBA) released their latest Mortgage Application Data for the week ending November 11 showing the overall seasonally adjusted Market Composite Index fell 9.2%. The seasonally adjusted Purchase Index fell 6.0% from the prior week, while the Refinance Index decreased 11.0%. Overall, the refinance portion of mortgage activity fell to 61.9% of total applications from 62.3%. The adjustable-rate mortgage share of activity accounted for 4.7% of total applications. According to the MBA, the average contract interest rate for 30-year fixed-rate mortgages with a conforming loan balance increased from 3.625% to 4.00% with points increasing to 0.39 from 0.38. For the week, the FNMA 3.5% coupon bond plunged 106.3 basis points to end at $102.734 while the 10-year Treasury yield increased 56.96 basis points to end at 2.3476%. Stocks ended the week higher with the Dow Jones Industrial Average gaining 50.12 points to end at 18,867.93. The NASDAQ Composite Index rose 86.59 points to close at 5,321.51, and the S&P 500 Index added 17.28 points to close at 2,181.90. Year to date, and exclusive of any dividends, the Dow Jones Industrial Average has gained 7.65%, the NASDAQ Composite Index has added 5.90%, and the S&P 500 Index has advanced 6.32%.
This past week, the national average 30-year mortgage rate increased to 4.12% from 3.87% while the 15-year mortgage rate increased to 3.35% from 3.13%. The 5/1 ARM mortgage rate rose to 3.05% from 2.92%. FHA 30-year rates increased to 3.75% from 3.62% and Jumbo 30-year rates increased to 4.22% from 4.00%.
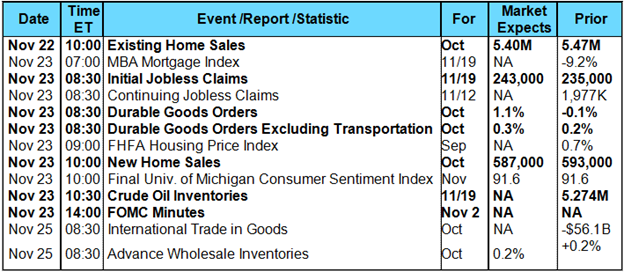
Economic Calendar – for the Week of November 21, 2016
Economic reports having the greatest potential impact on the financial markets are highlighted in bold.

Mortgage Rate Forecast with Chart
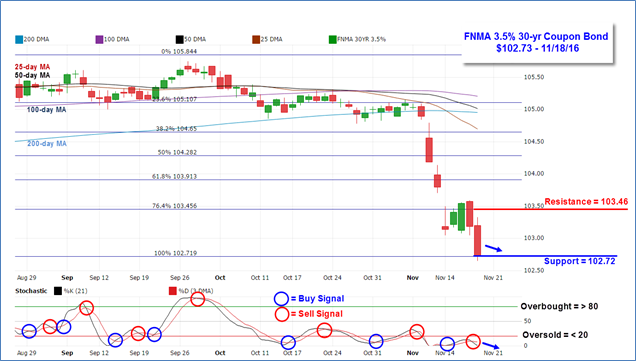
For the week, the FNMA 30-year 3.5% coupon bond ($102.73, -106.3 basis points) traded within a wide 93 basis point range between a weekly intraday high of $103.59 on Thursday and a weekly intraday low of $102.66 on Friday before closing the week at $102.73.
The bond fell below closest support following a rally attempt earlier in the week to challenge the next level at the 100.0% Fibonacci retracement level located at $102.72. Resistance is located at the 76.4% Fibonacci retracement level at $103.46. The slow stochastic oscillator is now showing a negative crossover sell signal while remaining significantly “oversold.” If support at $102.72 fails to hold, mortgage rates would likely continue to worsen as the next support level is found at $102.14.
Chart: FNMA 30-Year 3.5% Coupon Bond


